Author: Bob Stark

I'm a software developer and entrepreneur with a strong passion for intelligent systems, innovation, and collaboration.

Research Consulting Proposal

Problem Space

To hire, test out product features, and grow, startups need money before they start making profits—they need investment. Investors want to have confidence that a startup they invest in will be able to grow enough so that they get a return on their investment. As a result, a concept was established called product-market fit, which is when a startup’s product is useful to one or more customer market segments and competes effectively with other products in that space.

However, most startups are not able to achieve product-market fit. There are several reasons for this, but a key aspect of it is that their product does not does not serve the needs of any potential customers. In other words, their product does not solve an actual problem. A term to describe this problem is not having problem-solution fit. This is a bit misleading for products that offer novel interactions rather than solving a problem, but it could be said that not being able to interact with people as much, or as effectively, is the problem such products are solving.

Therefore, startups must reach problem-solution fit. Then, after identifying some potential users that the product solves a problem of theirs, a startup should find a subset of them or their managers that are willing to pay for it (customers). This is the first step toward achieving product-market fit. In other words, to achieve product-market fit, a startup must first identify customers that are willing to pay for their product.

Finally, after achieving product-market fit, a startup must grow so that they can acquire enough dominance in the market space to attract acquiring companies or file an initial offering to become a publicly-traded company (i.e., an initial public offering, or “to IPO”).

Technical Requirements

To reach problem-solution fit, or to make sure you build something that people actually want or need, many startups think of something that they would want or need, or use their gut instinct. However, such approaches, while a good start, are prone to error. At the very least, startups should test their solution’s core value proposition–the benefit that it provides to users and customers. This can be done with signup forms on landing pages or created content. Then, possibly using the potential users and customers from these tests, some iterative user or customer research is necessary to continuously confirm that they have a problem that your product solves, and that a large enough number of them have this problem for similar reasons.

To reach product-market fit, or to make sure your product is useful to one or more customer market segments and competes effectively with other products in that space, a startup must start by determining who are users and who are customers. They may be the same people, the customers may be managers of users of your product, or the customers may be organizations running ads to the users. Then a startup needs to understand users’ and customers’ needs to understand what product space they’re in and how to compete in it. Again, while subjective

views and gut instincts are a start, something more formal is needed to identify go-to-market opportunities and verify they would serve a large number of people or organizations. The tests ran to reach problem-solution fit are also helpful because they may contain information about users’ and customers’ needs, or because they may provide a list of people for user or customer research.

Finally, to grow, or to acquire enough dominance in the market space, a startup must optimize their successes delivering their product to users and customers and their success using it. Therefore, it is necessary for a startup to identify one or more channels to reach users or customers and deliver their product to them. Once the channels are identified, marketing funnels should be created for each of them, with potential users or customers and leads at the beginning, and prospects in the middle, and successful users or customers at the end. To increase the success between these funnel stages, a startup must iterate on their product and user or customer research to confirm their needs and success using it.

My Solution

The concepts of user experience (UX), human-computer interaction (HCI), and usability testing all have foundations from when a group of researchers in 1982 came up with the concept of cognitive systems engineering (CSE) in response to the Three Mile Island nuclear disaster of 1979. It was then formalized by a couple of those researchers in 1983 with the lens of people and machines working together as a joint cognitive system (JCS). With this lens, CSE became an approach to systems engineering to continuously verify one’s understanding of users and machines, their joint success or failures in operation, and how those failures can be addressed. A similar cyclical approach called human-systems integration (HSI) was also invented in the military to model each systems engineering iteration’s decisions as risk management. I have worked with both the researchers that invented these approaches, and their followers, in my past government R&D research scientist jobs.

While usability, HCI, UX, design thinking, and so on, are used in the world of tech startups, other concepts of CSE like JCS and the HSI iterative cycle of systems engineering have not made their way there yet. Therefore, I will use my knowledge of these methodologies and related processes and tools to help startups with user and customer research, and improving their products with that knowledge–iteratively throughout their product lifecycles.

Problem-Solution Fit

To help startups perform user research to achieve problem-solution fit, I will study users’ and customers’ problems and their environments that are relevant to the envisioned product. Including their environments is necessary because their problems do not exist in a vacuum: they exist because of other factors or constraints in their job or life, and cannot be addressed without addressing those factors, too. Since people’s activities in their lives may or may not fit a consistent schema, I will start by creating empathy maps on potential users and customers. These will involve what they say, think, do, and feel, and possibly what they see and hear.

Then, as I learn more about them, I will add structure to the empathy maps. While a common formalization of empathy maps is personas, which are fictional people that have the attributes documented in empathy maps, I will take inspiration from cognitive work analysis (CWA) when it is possible. CWA maps a worker’s tasks and activities to the goals that they help achieve and the worker’s overall objectives that they are trying to fulfill. CWAs are a powerful CSE tool because they capture a worker’s job in its current state, which help identify inefficiencies that can be addressed with a product, and they can be extended with features of a product to test its success. They can also be combined with personal details to create personas.

Also, although CWA is taken from work-centered CSE research, it can be applied to consumers–i.e., people using a startup’s product outside the context of work. In these cases, overall goals may be social connections, self-worth, or similar ideas, and goals and activities may involve going out with friends or posting on social media, for example.

To enumerate empathy map metrics, potential users can be interviewed and they can be observed doing their job using their existing tools. Together, these methods will identify their job’s overall objectives, the goals to achieve these objectives, and the activities used to achieve these goals. Job observation will then identify the specific tasks taken during these activities and the tools and constraints that affects their execution of tasks. Finally, surveys or focus groups can then be used to discover if these metrics are common among a larger set of potential users.

Once these metrics are discovered, they can be measured, and then bottlenecks or other problems can be identified. These are the opportunities for a new product. To evaluate the empathy map metrics, specific measures must be identified and job observation is needed to record the values of the measures. Similar to empathy map metric enumeration, surveys or focus groups can then be used to discover if these bottlenecks or other problems are common among a larger set of potential users or customers.

Finally, solution improvements can be made to improve these metrics, and the cycle repeats.

Product-Market Fit

To help startups perform user and customer research to achieve product-market fit, I will study previously-identified user’s workflows and customers’ needs. Empathy maps and CWAs may identify some tasks that are part of a user’s activities, but it is not focused on the structure of these activities and tasks. Therefore, I will start by creating user journeys, which are diagrams of the tasks or steps a user goes through while using the product.

Then, as I learn more about them, I will add more details to the user journeys by taking inspiration from cognitive task analysis (CTA). CTAs map tasks and activities to their cognitive states (e.g., goals that the user is trying to achieve with them). Although CTAs are taken from work-centered, CSE research, they can be applied to consumers–i.e., people using a startup’s product outside the context of work–in that, like CWAs above, the goals that the activities and tasks help achieve may be social or personal goals.

For highly structured jobs, and easily-observable tool usage, job observation can be used by itself. For more unstructured jobs, or for tasks that are more difficult to observe, methods like card sorting can be used, where a potential user sorts labeled cards about information, tools, or tasks they can perform to determine the order they prefer to achieve a goal identified in the CWA.

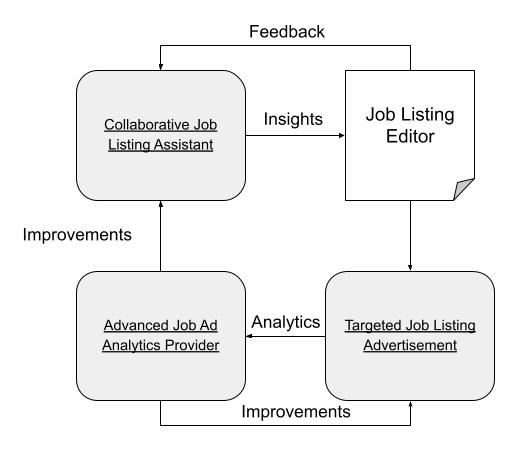
Then, go-to-market strategies and metrics to evaluate them should be identified. In the case of users being the customers, or users being the product to the customers (e.g., attention and data for advertisers), marketing funnels for the identified delivery channels can be extended, or supplemented, with product usage funnels from journeys that are modified with features of a startup’s product. Then, these funnels can be evaluated with analytics events embedded in the product, and user journeys can be evaluated with those analytics.

The customers’ needs also need to be understood, regardless of whether or not they are the same as the user. As a start, customers can be interviewed and documented with empathy maps. Then, workers’ objectives that were identified in the empathy maps can be mapped to their managers’ goals. Also, similar to user journeys, customer journeys can also be evaluated with job observation, interviews, card sorting, or analytics, along four stages (AIDA):

  • Their Attention to or Awareness of a product category or the product itself is increased: Advertisements, created content, etc., can be tracked in terms of the number of views they get and the percentage of interactions they get (e.g., click-through, CTR, of ads).
  • Their Interest in the product is increased: Starting with the percentage of interactions, other activities related to ads or content can be measured and combined to score how much a lead is interested in the product.
  • Their Desire of the product is expressed: Similar to interest, desire can be measured by more direct activity like downloading a product (if applicable), signing up to get notified when it launches, and so on.
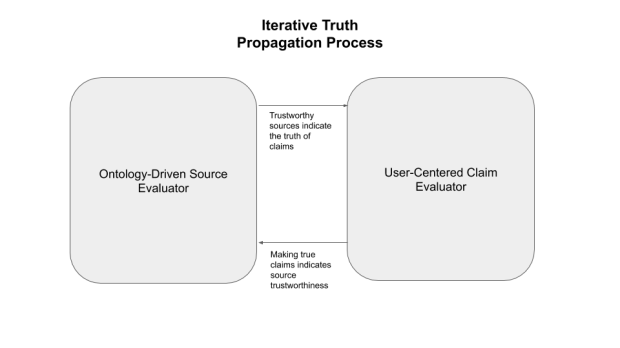
  • They take one or more Actions: For example, shopping around the product category, trying out the product, or buying the product. Having a certain number of large/popular companies as customers is often used to measure pm-fit, but startups can go further. Measuring product-market fit, both to optimize internally at the startup or for future investors can be done by doing cohort analysis on the metrics mentioned above — i.e., what percentage of people from a previous stage go to the next stage, all the way to buying the product. On the way to reaching product-market fit, a startup should make product improvements to improve these customer and user metrics.

Growth

To help startups grow, I will assist with the use of analytics to help iterate on product features to optimize key metrics–a process often called growth hacking. Analytics will be used for two purposes: to identify differences in users’ or customers’ patterns with a product versus the modified, envisioned journeys mentioned above, and bottlenecks in funnels with the end stages resulting in money for the startup. A common approach to grouping these metrics is “the pirate metrics”: acquisition, activation, retention, referral, and revenue (AARRR, like pirates say).

Existing analytics solutions can be used (e.g., Mixpanel, Heap, Segment), or a custom analytics solution can be created. Then, funnel events need to be inserted into the product to fire off when users take certain actions. Finally, the funnels should be visualized with aggregated data across users.

If the users’ or customers’ patterns do not match the envisioned journeys, then interviews can be done to identify reasons for the differences. Similarly, interviews can be done to identify reasons for bottlenecks in funnels that *do* match the journeys, but do not complete them. Then surveys and focus groups can be used to determine if these reasons are common.

Finally, changes to the product can be made to improve the analytics, and the cycle repeats.

NSF Seedfund pitch for Illuminate by Datagotchi Labs

Technology Innovation

Many frame the primary problem with artificial intelligence (AI) systems as users not trusting them, or as the AI systems not being trustworthy. However, automated technologies have always been a problem because they are not resilient in the face of unforeseen circumstances. In other words, AI systems are not trustworthy because they are unhelpful for data they are not trained on.

One solution to make these AI systems more resilient is to show where their outputs came from, and, if it is unable to provide a high-quality answer, why it was not trained on relevant data. However, many modern AI systems are based on deep neural networks. Therefore, they cannot practically show the path through their network that resulted in an output because they are billions or trillions of parameters large.

(1) To be resilient in the face of unforeseen circumstances, AI systems must show rationale that users can understand and react to when the systems fail, rather than just forcing users to recall them or assume that the system is always right. Therefore, our high-risk technology innovation will be a Collaborative Copilot that uses interpretable models. This is high risk because interpretable models often do not scale well with data, are not easy to develop like deep neural networks these days due to the tools from tech giants, and are expensive to train.

For interpretable models, linear rules would only be accurate for a very niche domain of data. Their extension into decision trees would not be easy to use because they cannot be automatically pruned. Bayesian networks would have similar problems, so we will use Causal Influence Models (CIMs). CIMs are Bayesian network UIs with connections going in the direction of influence and have colors and weighted lines to show the influence sign and strength.

Although relatively easy to understand, forcing users to read through full CIMs would still result in significant cognitive overload.

(2) To minimize cognitive overload, information system UIs must fit users’ mental states when they are doing work. To explicitly consider users’ mental states, they should be objectively modeled, rather than just guessed by the developers or inferred from biased surveys of users. Therefore, we will supplement the Collaborative Copilot development by designing and empirically evaluating Mixed-Initiative Workflows using a family of research methods called Cognitive Task Analysis (CTA). However, CTA models of users may not match users in the real world, nor do they capture the higher-level objectives and constraints of their work. Therefore, we will also measure the professional contexts of users using a family of research methods called Cognitive Work Analysis (CWA), which outline the objectives and goals of the users and map them to their activities and tasks.

Technical Objectives and Challenges

1. Prototype and Evaluate the Collaborative Copilot

We will build interpretable models with Python tools like Pandas, NumPy, SciKit-learn, and Matplotlib, and will compare our models to deep neural networks created with tools like TensorFlow and PyTorch. We will evaluate these models and compare them with deep neural networks on four metrics:

  1. High output quality: We will start with accuracy and machine learning variations on it like the receiver operating characteristic (ROC) and area under the ROC curve. Deep neural networks are famous for being very high quality, so this will be our primary metric.
  2. Understandability of outputs: We will verify that users can understand the machine’s output and determine if they are mistaken. We will do this by comparing users’ mental states with the Copilot’s models.
  3. Ease of development: Because interpretable models do not train and scale with backpropagation like neural networks, more technical expertise is likely required. We will specifically consider the technical expertise needed to run expectation maximization (EM) training on the networks.
  4. Training costs: Large corporations have the resources to build deep neural networks with large amounts of data, while smaller businesses and academia often do not. Therefore, we will explicitly measure the costs for the EM training. For expensive cases, we will consider incremental learning, where they can start out as linear rules, then become networks of rules, and finally become Bayesian networks.

2. Design and Evaluate Mixed-Initiative Interaction Workflows

We will design these workflows with mixed-initiative interaction: utilizing software to process data, generate models, and make suggestions to the user, and enabling users to not only request suggestions when they need them, but to also critique them when they are confusing or mistaken.

The workflows will be evaluated in two ways: (1) by matching the states of the users during tasks to the system’s output: to ensure that users understand the machine’s outputs, and (2) the performance of users and the software accomplishing the tasks together: to ensure that users can correct or take over for the system when necessary to increase resilience.

3. Validate Commercial Viability and Impact

In the Phase II, we will apply the innovations to a use case we have researched over the past few years: reducing information asymmetries between job candidates and recruiters to improve the efficiency of hiring. Therefore, in Phase I, we will work with user representatives from our previous research and development to confirm their commercial viability and impact.

Market Opportunity

  • Models: To ensure general use of the models we develop by individuals, they need to always be free. Furthermore, to enable academic research of them and both individual and commercial modification of them for different uses, they should be open source. However, we could offer support services for them to businesses.
  • Mixed-Initiative Workflows: The mixed-initiative workflows would likely be exposed via research papers, and thus would be de facto free and open source. However, for commercial usage, they could also be patented and licensed.
  • Candidate and Recruiter Tools: The candidate tools were always envisioned to be free to ensure high adoption. Furthermore, since the initial target users were senior software engineers, they could also be open source to enable customizations and improvements. The recruiter tools, on the other hand, are the primary market opportunity for Phase II’s use case. Whether the users are external or internal recruiters, they likely have a budget they can use to pay us.

Company and Team

  • Founder: I have a diverse background in technology and data science. I have a BS in Computer Science, and an MS in Information Science. I researched AI throughout undergrad and grad school. After grad school, I was hired in the government R&D field as a decision-support analytics research scientist and software engineer. I wrote SBIR and STTR proposals on human-machine collaboration and mixed-initiative interfaces, won many of them, and led the resulting projects. In other words, I have focused my entire career on these types of problems. I have also collaborated with many of the relevant researchers who have championed resilience engineering, cognitive task analysis, and cognitive agent rationale, and who would likely be happy to consult for this project. I then moved to California and have worked with several technology startups as a full-stack engineer, UX expert, and product manager.
  • Company Background and Status: Datagotchi Labs is an R&D lab I’m incubating to use the skills I’ve gained in my career. I have explored several ways to make money, starting with a Patreon page, spinning off this project to raise investments, and running Kickstarters for the consumer-side of the projects. Since none of these have been successful, in addition to pitching to the NSF Seedfund, I am currently working on a marketing campaign to better establish myself on social media to attract some consulting leads and offer freelancing services.

Datagotchi Labs: Empowering People with Information

Our economy is based largely on exploiting both natural resources and people for profit without regard to how it affects either the earth or those people. To protect themselves, those in power hide as much information they can about what they are doing. For example, corporate reporting structures are designed to keep lower-level employees ignorant of what executives are doing with their company. Similarly, news website paywalls keep people from knowing important information, even if it affects our democracy! When information is available to people, it is often distorted with complete or partial lies. Failing that, useless information is often used to distract people from important truths.

Many people in the world are working on solutions to these problems. For example, there are people working on data visualizations, which are better than raw, tabular data, but often do not have the necessary context to make them useful. There are many working on investigative journalism to get important information out to people, but these efforts do not decrease the amount of information that is overloading people. As a result, some people have resorted to protests to get out the word on information they think is important. However, this is still dangerous in our democracy because those in power will find ways to disenfranchise them by firing them from their jobs or even arresting them. Most importantly, none of these efforts are focused on enabling people to use the information once they get it.

Instead, people need to be empowered with information. That means giving it to them in the contexts where they can use it. For example, company information would be helpful when deciding whether or not to join or stay at a company; news about global warming would be more useful with tips on what to do about it; and information on a product’s supply chain is useful when deciding whether or not to buy it.

However, while such contextualized information can empower some people, it may not empower people who are not in those contexts. For example, an employee who can’t leave their job because they are in debt would not find the extra company information useful; most people are disenfranchised when it comes to making global warming mitigation policies; and many consumers need lower-priced products so they don’t break their budgets, rather than more moral products.

In other words, people need to be empowered with information in way way that guarantees that it is useful in some way. Even if they can’t directly use it, like information in a representative democracy, they deserve to know it because it affects their lives. Therefore, for the examples above, company information, global warming news and suggestions, and product supply chain information should be easily available — not just upon demand, but to others who may not think to make the demand.

Therefore, I am officially launching my initiative, Datagotchi Labs, to truly democratize information. This means that my products will be focused on this goal, and will always be free for people to use. Requiring them to pay for these capabilities goes against my motivation for creating the products in the first place. It also means that the products’ creation and improvement will be collaborative with any and all people who are interested in participating. While I have a couple of products already in their early stages, I plan to include interested people more in the creation of future products. In the meantime, I plan to involve everyone in the testing and improvement of the Inspect and Counteroffer products once I launch them.

Since I am now devoting myself to incubating Datagotchi Labs full-time, collaboration will start in the form of a Patreon page, where members can pledge a monthly donation to me (starting at $5/month) in exchange for updates, involvement, and early access to my work.

Even if you can’t afford $5/month, though, I would still like to invite everyone to the Discord channel to chat about products Datagotchi is currently working on, and can work on in the future! Find it here.

For further reading

My Solution to Using Leverage to Make Demands from Employers

To make demands from employers, either before applying for a job or after a yearly performance review at a job, I have found in my research that the missing piece keeping employers from responding, and responding well, is illustrating your leverage

To show leverage before getting a job, a solution must combine weighted candidate preferences with filterable, anonymous experiences mapped to job requirements. For candidate preferences, many of them are often discussed on an initial “short call” with a recruiter. This call often ends up not being as short as promised, and being stressful and relatively useless for the candidate. Instead, as much of this information as possible should be available to the employer before any calls occur, if any still need to happen at all. 

To weight these preferences, the most obvious of the options is to put the most important ones first. However, this approach does not support changes in the order based on the type of job or employer. Also, to support that functionality, specifying orders based on an infinite number of options is not practical. Rather than linking preferences to all possible desired job types and employer types, they should be linked to a smaller set of options. Creating static versions, or themes, for a subset of all possibilities still does not enable adjusting them to slight or drastic changes based on interactions with an employer. Therefore, I propose linking the preferences to pre-specified portfolio themes that can be easily adjusted on-the-fly to more closely match a job opportunity or employer’s preference. 

Experiences are often grouped together to best match a job listing to which a candidate is applying in a static resume. This has to be adapted for every job listing they apply to, often even if they are the same job type and in the same industry. Instead, a live web page of their experiences should be used so employers can identify their strengths and weaknesses across any or all relevant attributes. 

Furthermore, such a live web page should show their current experience(s), even if they aren’t necessarily related to an employer’s particular job, so it’s clearer that why they may not be looking for a job. If an employer can filter by particular attributes, that would enable them to both see their current job for this reason, and to determine the candidate’s fit without having to look deeply through every experience. 

To anonymize the experiences to reduce or eliminate bias for (or against) particular employers, just doing so would not work because then the context of their job would also be removed. Therefore, some amount of context should be included, such as the company’s industry, approximate size, and status as publicly traded or private. For example, a “large private tech company,” a “publicly-traded energy company,” or “a series D health tech startup” may suffice instead of company names. 

When put together, particular candidate preferences and particular work experiences could distract from the rest of the page. To address this problem, one section of the page should be hidden when the other section is in view. However, doing this could cause the employer to forget something from the other section. Therefore, pinning items from each section should be supported so they are shown when viewing the other section. For example, a candidate preference to work remotely may be pinned while looking at their experiences, to see if their qualifications outweigh this perceived downside by many managers. Similarly, the amount of time a candidate has in a particular technology or skill could be pinned while looking at their preferences, so that their qualifications may outweigh their need for visa sponsorship. 

The resulting component will be called the Dynamically-Targeted Online Portfolio. It will by default be shown as a web page, but could also be rendered in a mobile application to support both viewing by employers on-the-go as well as candidates making minor edits on their phone. 

To show leverage while having a job, a solution must chronologically show job qualifications and performance weighted by coworkers all in the context of union leverage

To start, an employee’s previous qualifications that got them the job should be shown because those qualifications should still be relevant, unless their job changes changed substantially since they were hired. Then that can be combined with their current year’s performance by mapping their year’s goals to their successes (e.g., deliverables, meetings), and confirm these claims by weighting them with upvotes from their coworkers. To integrate these two types of information, qualifications should be shown on the same timeline as this year’s job performance. To rank performance metrics in both contexts, a simple binary system could be used to measure subjective successes or failures. However, that would not take into account the upvotes from coworkers. On the other hand, upvote counts would then make qualifications look like they only received a single upvote. 

To equate these two types of information, I propose using the percentage of coworkers that upvoted a success and the binary qualifications, thus making both of them between 0 and 1. Even then, though, not all coworkers know about an employee’s performance in each category. Therefore, this percentage should be weighted by coworkers that respond, even if they respond that they do not know enough to upvote. For coworkers that respond that the employee did not perform well, the net percentage (i.e., (upvotes – downvotes)/total votes) should be used. Then, these can be supplemented with their successes from previous years at this job, if applicable, to show how they have continued to perform well, or, even better, improved. 

With this greater amount of chronological data, dimensions will likely change over time – not only because a job’s performance metrics change after a candidate is hired, but also because they changes year-over-year. Both the previous metrics and the current metrics should be shown to show that they have changed. Presumably the current ones should be more visually salient, though. One option is to hide old metrics by default, but this would not show what they changed from. Another option is to gray them out (i.e., make them look “disabled”) or blur them. This would be better than hiding them, but indicating why they changed would be best – for example, showing an icon over them that indicates they are for more junior employees and thus not directly measured in more senior ones anymore, or they are no longer relevant.

Finally, union strength will show that, even if they are not necessarily improving over time, they deserve to be given support from from their employer to enable them to do so. Union strength itself can be shown in the form of number of members in the union and/or percentage of the company’s employees in a that job area. However, that alone is likely to be interpreted as an act of aggression toward the employer, rather than something more collaborative like needing support because they are going through hard times. Therefore, this information should maybe be shown implicitly, though not so much that it is not noticed for what it is. For example, changing the background or foreground color of this year’s performance metrics to match the union’s logo is probably too implicit to be noticed by the employer, while showing the union logo itself on this view might be too explicit. Therefore, I propose an explicit indication that does not, at least at first, indicate it is about union membership. For example, showing a ‘?’ icon above either a less-good, or reduced compared to last year, job performance metric that explains more details in a popup. 

To combine all of these aspects together, I will create a Chronological Employee Performance Meter. Its main view will be a time series chart, starting with the on the left with the employee’s predicted value when they were hired using data from the Dynamically-Targeted Online Portfolio component above – i.e., it will show job requirements versus tags in the portfolio. It will then show the employee’s successes, both for this year and past years the employee has been at this company. For “skilled” or knowledge workers, the Y values of this chart can and should be quantitative measures of the successes weighted by their coworkers in the form of yearly reviews. For “unskilled” or manual labor workers, their success claims can perhaps be confirmed or denied by their manager. Either way, their past and current year’s reviews should be supplemented with commitments from their manager to help them improve in the aspects of their job that they underperformed in. Finally, it will link the underperforming notes and commitments from their manager to improve on them to their union strength, if applicable, to give their manager a greater incentive to keep them rather than fire them and lose all of their union members at the same time. For job improvements due to legitimate critical reviews, the union strength communicates that their manager should collaborate with them to improve their value to the company in the best possible ways. For life circumstances that may cause employees to underperform intermittently, the union strength communicates that their manager should support them because they are a human and worthy of it. 

To contextualize questions and demands with importance and leverage from both good qualifications/performance as well as human needs, both types of context need to always be shown, and should be easily-identified as different. 

To show questions and demands, a user interface (UI) that is familiar to the employer should be used, ideally in the same form for those employed in the company as well as those who may be a good fit for a job in the company. Therefore, I will use a survey UI that frames demands as questions on whether or not they can satisfy the demands. Furthermore, I will make their high importance clear, along with additional leverage. 

To contextualize the questions with importance, putting them in a particular order might work. However, like with candidate preferences above, that does not support changes based on different types of context. Therefore, the order of questions should be tied to known types of context, such as high or low expectations of an employer’s reception to being asked the questions. For example, a raging job market for software engineers may suggest that the candidate has additional leverage over employers, so they may choose to put questions about salary and working from home first in the survey. On the other hand, an employer who has not recognized a union yet is unlikely to respond well to some types of demands, so an employee may choose to not make them for now. To support both of these types of situations – order changes and removal of questions – survey “themes” should be created beforehand, and should also be easily changeable depending on the situation.

To contextualize the questions with leverage, the above ideas for how to illustrate different types leverage should be combined with the survey UI. 

For relevant experiences that give one leverage for a job, mapping them directly onto the job requirements is a good first step mentioned above. To show this leverage with the survey questions, though, this information should be used in an easily-understandable format. For example, the percentage of job requirements that are satisfied from past experiences could be shown in a horizontal bar above the survey. However, that does not show the number of experiences that fit individual requirements. A better visualization for that would be a stacked bar chart that splits the bar into sections for each requirement and colors them based on how many instances in the candidate’s past experiences. 

For good performance reviews that give one leverage because they are an especially-valuable employee, the idea above is to show timeline – i.e., a line chart with the X axis indicating time. For a question survey, putting it above the survey UI like the stacked bar for candidates would be a good use of space, and would make the survey UI more consistent for employers who see it for both new candidates and existing employees. 

For union strength leverage, the above idea is to show indications of poor performance on the timeline with explanations on how union strength suggests the manager should work with the employee to address them. Fortunately, this can be used directly with the timeline shown above the survey UI discussed in the previous paragraph. 

Finally, once an employer answers the questions in the survey, this information should be used for the benefit of the candidate or employee. If the question response is deemed of high-enough quality (whether or it is a possible or negative response), it should be usable in a variety of ways – either in its raw form, or to trigger other actions. To support the latter use, a response outcome model of some sort should be created along with the question, like the If-This-Then-That (IFTTT) tool. For example, if the question is a demand with a negative response, then that information can be immediately sent to the union. If the question response is not of a high quality, then the candidate or employee should be able to respond to the employer to explain – e.g., why they asked it or why the employer should answer it – i.e., by stressing their leverage. 

To integrate these ideas in a single component, I will create a Visually-Annotated, Linked Survey Tool. This tool will include the main survey UI, annotated above with either a stacked bar qualifications visualization or a job performance timeline. For the qualifications visualization, clicking on a bar section will bring the employer to the Online Portfolio to show the particular experiences that were used to calculate its color. It will also include a question editor to specify actions to be taken on types of responses, either assigned to options in a multiple choice question or a aspects of an open-ended question (e.g., parsing a number of out a response about the salary of a job).

Using Leverage to Make Demands from Employers

Earlier in the pandemic, anywhere from 40% to 95% of workers were considering quitting their jobs, resulting in a movement later in the pandemic called the Great Resignation. Some people that quit their jobs have looked into new sources of income, such as freelancing, coaching, or running their own Twitch, YouTube, or OnlyFans channels. For those that are successful, going back to working for a company is not very tempting, meaning they have a large amount of leverage when approached by employers. Not everyone who has quit their job has the time, energy, or skills to do those types of things, though. Therefore, they need to find a job themselves, and they will have leverage for ones for which they are qualified.

For those who have not quit their jobs during the Great Resignation, it is either because they are happy at their job or because they are paralyzed by the fear of not finding a new one. Even those identifying as happy at their jobs are becoming less happy because they are realizing that they prefer working from home while their employer is asking them to come back to the office, or because they were not actually fulfilled in their job in the first place. For many unhappy at their jobs, conditions have become so bad that they are not sure how they can manage their jobs and their lives at the same time. For these workers, lack of recognition for performing well at their job and lack of support for improving are becoming all too common, and so a growing response is to create unions – both in “unskilled” service work like shipment factories, grocery stores, and cafes, and also in knowledge work like tech companies – to demand better work conditions, pay, and benefits. Many of these unions are seeing increasing amounts of success, and thus have greater leverage because employers fear losing even more workers to the Great Resignation.

In other words, nowadays people have much more leverage against employers than they ever have. However, they either do not know this, or they do not know how to use it. 

  • For employable people outside of a particular employer, leverage can be utilized in either response to an employer contacting them, or while applying to a job at that company. In response to the employer, leverage can be used before even talking to them on the phone because they were qualified enough to be contacted. While applying to a job there, people can use leverage when they find a job because they qualified. Therefore, the employable need a way to illustrate they have leverage for a new job because they are not looking for a job and/or because they are qualified.
  • For those already employed, leverage can be utilized to make demands to increase the quality of their job, either outside a union or within one. Outside of a union, employees can use their job performance as leverage, or because they should be supported to improve. Failing that, employees may decide to form a union and cite its strength as leverage. Therefore, employees need a way to illustrate their leverage from their job performance and/or their union’s strength.
  • Once they figure out how to illustrate their leverage, both the employable and current employees then need a way use that leverage – to make demands alongside their leverage.

Technical Requirements

To assist the employable illustrating they have leverage for a new job because they are not looking for a job and/or because they are qualified, these types of leverage are commonly illustrated separately, and in vastly different ways. 

To illustrate that they are not looking for a job, the lack of application in an employer’s system is often taken to mean that. However, they may not have heard of it, or they may not have gotten around to preparing materials for that specific job because it is a lot of work. Instead, taking inspiration from job boards might make more sense, where a candidate explicitly indicates whether they are actively looking for a new job, open to offers, or not looking for one at all. Also, to further expedite the interviewing process, additional information such as their location and commuting preferences would be helpful. While all candidate preferences are therefore useful, some are more relevant to employers at first than others. Therefore, any solution must not only list all of them, but also weight them according to their relative importance. 

For actual jobs they are open to, though, candidate preferences should be taken further to include the types of jobs they are open to and the skills they would use in them. Furthermore, additional proof that they don’t need a job may be helpful even if they are doing something vastly different than they used to do when they were employed by companies. For example, freelance work, successful social media channels, or coaching businesses, etc., should be shown even though they would not otherwise be considered relevant to a new job.

To illustrate high qualifications, past experience at an impressive employer is often used to suggest them. But in reality this has little or nothing to do with how qualified they are for jobs at other companies. Therefore, experiences should be shown as proof of qualifications without mentioning the specific companies that brought them that experience. As a backup, recruiters then start looking more deeply at a candidate’s past experiences to see how qualified they are. However, this is limited by the amount of technical knowledge the recruiter has – which is often very little – so it is likely to take the form of identifying specific technologies and languages that the job listing specifies. Instead, it would be much more effective to explicitly map the job requirements to their past experiences. Furthermore, it would be even better to allow employers to filter experiences with job requirements they are especially interested in.

While two solutions for these types of leverage would be useful in their own right, it is important to keep them together so that a candidate match can quickly be ruled out before looking into their past experiences. 

Therefore, a solution is needed to combine weighted candidate preferences with filterable, anonymous experiences mapped to job requirements. 

To assist employees illustrating their leverage from their job performance and/or their union’s strength, these types of leverage are also almost always illustrated separately and in vastly different ways. 

Leverage from an employee’s job performance is often communicated implicitly rather than explicitly. For example, past relevant work is assumed to imply that they have performed well at their current job. However, this does not take into account the possibility that they moved on from a previous job – even at a highly-respected or hyped company – because they do not perform well. Instead, it would be better to ignore their previous employe’s impressiveness since they were hired at their current job, and to enumerate why they were hired and how those reasons continue to be relevant. For employees that have been at their current job for more than a year, their previous years should not be ignored. Instead, previous years should continue to be communicated to show how they have performed and improved at their job. Furthermore, rather than just showing both their initial qualifications and their past job performance, they should be combined in such a way that shows how their initial qualifications have converted into good job performance. 

Additionally, a lack of complaints from their coworkers is often taken to mean that they are performing well at their current job. However, their coworkers may not have been explicitly asked, or they may be hesitant to outline ways that the person has underperformed. Instead, it would be better to include their coworkers’ feedback. However, rather than asking coworkers to frame the feedback, though, which puts an extra burden on them and does not standardize feedback from across coworkers, a better solution would be to weight an employee’s claims about their performance by their coworkers.

Finally, one’s union strength is often not communicated at all, since the employer is expected to already know about it. However, this may not be the case if the union has not (yet) been formally recognized by the employer. Even if it has, its strength may not be considered by one’s manager. Therefore, it would be better to directly communicate union strength to indicate they have some leverage. Furthermore, rather than listing it by itself, which makes it easy to ignore or brush aside, union strength should be used to emphasize all other kinds of leverage being illustrated.

While multiple solutions for these two types of leverage would be useful in their own right, it is important to keep them together so that a holistic view of an employee’s value to the company can be shown as leverage. Therefore, a solution is needed to chronologically show job qualifications and performance weighted by coworkers all in the context of union leverage.

To help everyone make demands alongside their leverage, the demands need to be contextualized by their leverage, rather than just listed next to it. Also, while good qualifications and performance can be used for leverage, they should not be the only way that leverage is illustrated.

For the employable people outside of a given company, they need to use leverage to get a new job and at the highest possible level (i.e., assist their negotiations). This will likely take the form of their preconditions for working for the given company, as well as requesting information about the company to compare it to others. Given that some are demands and some are, possibly optional, questions, the importance of responses should be shown differently. This is especially true because even demands would best be phrased as questions that require an employer’s answer on whether or not they support the demands, and how. This is commonly done for questions by marking the required ones with an asterisk and possibly using red coloring suggesting that answering them is “urgent.” However, such a binary system of optional and required may not be sufficient to communicate how important demands and answers to questions are. Therefore, a multi-layered ontology of importance should to be used.

For the employees of a given company, they need to use leverage to get rewarded for good performance, and, when admonished for underperforming, get support from management. For good performance, this will likely take the form of getting promotions and raises. On the other hand, underperforming could be because the employee needs to learn more so they can get better at their job, or it may be because their work conditions do not enable them to perform at the expected level. In both cases, management should support them, either by paying for additional education or training, or by better accommodating their needs. In either case, this would take the form of demands of management directly linked to indications of good performance or needs for improvement. 

Given both above cases, it’s clear that everyone has leverage to get information or make demands from an employer regardless of how well they have previously performed, even though they often think that they don’t. It’s just that the type of leverage will change depending on context and time. Therefore, a solution is needed to contextualize questions and demands with importance and leverage from both good qualifications/performance as well as human needs.

My Solution to Hiring in the Wake of the Pandemic

This post is my solution to the problem I outlined here about how the pandemic has drastically changed hiring practices.

A solution to aggregate recent data with established wisdom to create and edit job listings can be done in several ways. For example, prioritizing newer information over older is insufficient because some insights are timeless, such as the fact that years of experience is usually valuable. Furthermore, combining data from several sources is painstaking work that often takes up entire data science and engineering teams. 

Some of this work can be automated with artificial intelligence. However, using complicated statistical models like deep neural networks to shortcut this process is not only not interpretable, but is also very expensive to train, with training a single model polluting more than five cars throughout their entire lifetimes. Instead, an interpretable assistant is needed to recommend data’s insights and its reasoning, which gets better over time by collaborating with the human user. To implement these ideas, I will create a Collaborative Job Listing Assistant

To post relevant job listings across the web, the traditional approach of duplicating a job listing across multiple job boards requires formatting to different formats required by each board. Then, once posted to each board, it’s difficult to update unless all postings are centrally tracked — requiring a whole other team to manage. Even in that case, though, such a team would not have any guidance for how to update the listings. 

Instead, an approach is needed that can take advantage of a simple job listing format and be posted around the web. To accomplish this, I will use online advertisements as inspiration, with more of a focus on Google search ads than irrelevant banner ads. Given that, the ads will be targeted to people’s actual needs, rather than trying to steal their attention from their current task. 

However, since the ads will be hosted on other websites, additional metadata about the websites will be collected and used to target the job ads. Based on the types of jobs being advertised, other common websites for people in these industries will be used. For example, job ads on Hacker News, Slashdot, or Stack Overflow could be target to software engineers. The resulting component will be called Targeted Job Listing Advertisements.

Using this advertisement system, a solution to track the performance of job listings with actionable metrics seems relatively straightforward. However, listings on job boards usually do not have analytics, at least ones that are actionable. Instead, they more likely provide simple analytics like the number of views, clicks, and applications submitted from your job ad. Such analytics will illustrate a very simple conversion funnel, but nothing more. 

It would be better to know more advanced analytics, such as time spent on a job listing, time spent on other companies’ listings, which ones candidates apply to, and the properties of those listings and companies. Therefore, links in job ads will go to a separate website that tracks these more advanced analytics. The resulting component will be the Advanced Job Ad Analytics Provider, and with it employers will be able to improve their job listings and the advertisements across the web.


I am working on addressing this problem right now. For more information, feel free to email me at bob@datagotchi.net.

Hiring in the Wake of the Pandemic

After the pandemic broke out, upwards of 4.8 million people in California alone lost their jobs. After more than a year of vaccinations and economic reopenings, that number is closer to 600,000 people still unemployed, but many, especially knowledge workers, have decided they don’t want to work for their recent employers anymore. In fact, of those who are still employed, anywhere from one third to 95% of them are considering quitting their jobs. 

Both groups are reluctant to return to work for a variety of reasons, including return-to-work requirements, their ability to find higher-paying jobs, and, for workers like nurses, because their previous job was just too exhausting. Return-to-work requirements are problematic not necessarily because workers dislike working in offices, but because of the commute. A large number of people have left urban areas during the pandemic because they could work from home and didn’t need to commute, or because they want somewhere quieter and less likely to infect them with COVID-19. In addition to opting for higher-paying jobs and the ability to work from home, workers are also likely to look for benefits like educational assistance, unlimited vacation, a home office stipend, and a signing bonus. 

As a result, there are a very large number of unfilled jobs right now — some saying it’s the craziest job market since the 1990s tech boom — and employers are having a hard time hiring for both the positions they laid off during the pandemic as well as for new positions. 

  1. The first reason employers are struggling to fill open positions is that they don’t have a clear idea of what they’re looking for. For example, a few years ago a recruiter we were interviewing told my team his tech company clients were asking him to “just hire good engineers,” and more recently a pizza chain in Alabama stated they will “literally hire anyone.” 
  2. The second reason they are struggling is that employers don’t know where to find candidates. Many job boards exist, but it’s not clear which ones to use. Furthermore, many unemployed people are not actively looking for jobs, and even if they are, they’re most likely using their friends, family, coworkers, and other connections. As a result, some companies are offering up to $50k referral bonuses. 
  3. Finally, the third reason is that employers don’t know what the candidates are looking for. While there are stories, like those mentioned above, that have workers demanding to work from home, seeking higher pay, and benefits, it’s not clear to employers which of these workers would demand, versus which might be added bonuses that could help them differentiate themselves. 

Technical Requirements

Because employers don’t have a clear idea of what they’re looking for, they cannot just create job descriptions like they have in the past. First of all, the pandemic has taught workers that they can demand more than they previously realized, such as the ability to work from home or higher pay. Therefore, well-known job listing best practices may no longer necessarily apply. Also, while looking at other examples online is tempting, those would be from other companies that are possibly in different markets. Therefore, a solution is needed to aggregate recent data with established wisdom to create and edit job listings

Given that employers also don’t know where to find candidates, posting to all available job boards online isn’t sufficient anymore. It can be a lot of work to post to all of the boards, and expensive to hire someone to manage the process. Instead, employers need to find candidates on other websites that they visit. However, it’s unclear what sites are best for a given job. Therefore, a solution is needed to post relevant job listings across the web

Finally, even with a tool to do that, employers don’t know what the candidates are looking for. Rather than hoping for the best with traditional job listings, they could ask people directly or use surveys to see what they’re looking for, but that is expensive and time-consuming. Furthermore, such knowledge would not stay up-to-date as the job market changes, like it didn’t this time around. Employers could also read recent articles and other sources online to learn how the job market is changing, but, like all information on the internet, it’s unclear what take seriously and what to ignore. Finally, such approaches don’t capture what companies candidates end up choose over others, and why. Instead, a solution is needed to track the performance of job listings with actionable metrics.


I am working on addressing this problem right now. For more information, feel free to email me at bob@datagotchi.net.

My Solution for Tracking the Reliability of Information

To know what sources to trust, we rely on institutions in a similar way as we do for information itself. However, just like institutions are failing us with information, they are also failing us about what sources to trust. This is why a canonical model of trustworthy information sources created by an organization like Facebook, Google, or the government would not be trusted by a large number of people. Therefore, to reliably create and share source trust data, we need to work with people that we still trust, such as our friends or family. To share trust data with these close connections, my approach is to model the information sources–including our personal connections–and their relationships computationally. 

To computationally model these information sources, relational formalisms like social networks, concept maps, and semantic web languages provide some inspiration in that they explicitly enumerate all the ways that entities are related to each other. Information sources can thus be modeled as having made information claims, as having authors, as being a news agency or a social media poster, and as being trusted or mistrusted by various people, all in the same model. Then these properties and relationships can be used to evaluate the trustworthiness of the sources — e..g, making “is trusted by my friend” one metric of a source’s trustworthiness. 

With this additional “meta-information,” the trustworthiness of information sources can be estimated when you see a news article or social media post, and this estimate can be visualized. Visualizing meta-information can be done with color, size, or opacity — e.g., maybe a source is more trustworthy if it is more opaque, or maybe it is less trustworthy if it is outlined in red instead of green. Along with these basic visualizations, the details on how those visualizations were generated could also be exposed to users who are interested, such as which connections of yours labeled it as trustworthy. This method of exposing the evaluation’s rationale (also known as “explaining” itself) is called progressive disclosure. To combine these ideas, I will create an Ontology-Driven Source Evaluator.

To consistently evaluate the truth of claims, two separate steps are required: 1. enumerate the claims a source is making in an article, post, or other communication, and then 2. evaluate the truth value of these claims. 

To enumerate the claims a source is making, it would be tempting to automatically scrape the content of a news article or social media post from the web page it’s on. However, this is not a great idea, at least initially, for a few reasons. First, lazy loading of content with scripting makes it difficult for an algorithm to know when to parse content. Second, document structures change over time, so successful scraping of content at one point in time will eventually break when the document structure changes. Finally, there are inconsistent document structures across sources, which means that the scraping code will have to be specialized for every information source. 

It would also be tempting to use natural language processing (NLP) to extract the claims from a news article or social media post, but this is problematic as well. First, it’s very difficult since claims are written in different dialects, with slang, and so on. Second, it’s computationally expensive when evaluated against a language model to extract sentences, phrases, and claims. Finally, it’s untrustworthy when done with something like a deep neural network because its evaluation of a claim is completely opaque to the user. 

A better approach, especially to start out with, is to enable the user to label text in a news article or social media post as a claim. This is rather manual, so it can be later supplemented with source-specific scraping templates for high-popularity sources (e.g., the New York Times or Twitter.com) and NLP suggestions of what might be a claim in a body of text. Then these algorithms can be further improved by teaching with previous manual labels about what words or phrases (n-grams) might indicate a claim statement. 

To evaluate the truth value of these claims, user labeling is a tempting approach given its use to identify claims mentioned above. However, while users can be trusted to identify language that indicates a claim, they cannot be expected to reliably evaluate the claims for their truth value because they likely do not have the knowledge to make this judgment, and they very likely have their own biases about what is true and what isn’t. Therefore, it would be better to corroborate a claim made by a source with other trusted sources (including news articles, social media posts, and our personal connections). If they agree on the claim, then it is likely true. Also, the claim can still be manually labeled when a user has additional external knowledge on the subject matter. The resulting component will be the User-Centered Claim Evaluator.

To use true claims to improve source trust data, an iterative process needs to be used because neither the truth of claims nor the trustworthiness of information sources can be entirely determined by themselves. Once you label a claim as true, your connections will see a claim populated with your trust label before it is evaluated against their source trust model. For your and your connections’ source trust models, the trustworthiness of a source can be incrementally increased as it makes more true claims. Over time, this Iterative Truth Propagation Process would converge into a distributed knowledge graph. Eventually, such a process could also generate new insights by synthesizing claims from one’s record of true claims.

Because this process is a recursive loop, it needs to start out with some data for both source trustworthiness and claim truth. Therefore, I will create initial models based on my own knowledge and research. Eventually, additional “experts” can restart this process with their own initial models.


I am working on addressing this problem right now. For more information, feel free to email me at bob@datagotchi.net.

Tracking the Reliability of Information

As the world becomes more connected and more complex, it is increasingly difficult to know what to believe. Ideally, we would simply believe what happens to be true, but events happen far away from us, to other people, and we usually hear about them after the fact. Therefore, we need to trust that other people are telling us the truth. As a society grows, this sort of trust in others results in institutions like religions, cultures, and organizations, which members then look to for beliefs, norms, and values. 

However, creation of new institutions and changes to existing institutions are done by those in power. As a result, much of our society is based on assumptions created by the powerful, such as “it’s important to work and be productive” (capitalism), “it’s more important to take care of yourself and your family first” (individualism), and even things like “smoking is cool (even though it kills you)” or “being skinny is the only way for others to like or respect you” so tobacco and beauty product companies can sell more. Lately there’s been an even larger increase in their use to serve the powerful and reduce institutions’ ability to function in their original framing, including businesses and states reopening to make money during COVID-19 rather than protecting their customers’ health; focusing federal agencies like the EPA on reducing regulations instead of protecting the environment; and the Catholic church being more about protecting child molestors than providing religious community.

Since we can no longer rely on many institutions, we will need to make sense of the world ourselves. That way, we can know the risks and the medical and other effects of reopening businesses; the effects of pollution and their severity; and when we can trust religious leaders. Nowadays, there are so many different sources of information — from news paper websites to social media posts — that it overloads us. Some information sources are more reliable than others, and it’s difficult to know which ones are. Furthermore, information sources contradict each other, either because they have different agendas or are based on different belief systems. 

In spite of these issues with sources, we will still need to refer to external sources for most of our information given the complexity of the world and the information in it. 

  • Therefore, we need to determine what sources we should trust, and which ones we should not. Once we know what sources to trust, we can also trace information back when it’s shared by others to its original source and determine whether or not to trust it. 
  • We can then also start to be confident that what we learn from them is the truth, but we may also want other ways to verify the truth of claims
  • Once we are confident that what we read is true, then we can share it with others. However, for it to be valuable to them, we would still need to share true information with others in a way that they can use it both immediately and in the future.

To determine what sources we should trust, people should not just continue using their currently-trusted sources because they are often trusted for reasons we are not aware of. We could also simply ask our friends and family for their trusted sources, but they may fail to tell us the full truth (intentionally or not), and they probably don’t have a good reason for trusting certain sources, either. Therefore, a more reliable way to determine trusted sources is needed, preferably supplemented by insights from our connections. If we scope the problem to news on the internet, then a solution is needed to reliably create and share source trust data.

To verify the truth of claims, people cannot trust their or their connections’ gut feelings because they are often as opaque to us as our gut feelings on what sources to trust. Furthermore, our gut feelings change over time, even though the truth of a claim does not change. Therefore, a solution is needed to consistently evaluate the truth of claims

Finally, to share true information with others in a way that they can use it both immediately and in the future, it is not sufficient to send it to them. They might read it and learn a piece of information, but a week or month from now they may forget it, or at least the medium in which they received it from you. To be able to use this information in the future, it needs to be saved in a way that helps them interpret information they see in the future. Therefore, a solution is needed to use true claims to improve source trust data that will help them evaluate claims against the trustworthiness of the source.


I am working on addressing this problem right now. For more information, feel free to email me at bob@datagotchi.net.