News

Version 4: Local-First Peer-to-Peer (P2P) Architecture

While Version 3 successfully solved the user-adoption and text-overload crises by introducing relational sensemaking visualizations, its reliance on centralized cloud databases created a dangerous structural contradiction. Forcing users to route their deepest cognitive models, localized wealth strategies, and collaborative organizational networks through centralized servers exposed them to the exact corporate telemetry, data enclosure, and institutional capture we are rebelling against.

Version 4 is our active 2026 engineering milestone. We are completely cutting the cord from centralized clouds, migrating the entire Inspect engine into a fully decentralized, local-first, peer-to-peer (P2P) architecture.

Engineering the Local Firewall Boundary

To guarantee absolute cognitive sovereignty, Version 4 treats the user’s local machine as the primary, unassailable data boundary.

  • Local-First Persistence: Proprietary data arrays, mapped insights, and primary source documents physically never leave the user’s local hardware. This eliminates predatory vendor cloud infrastructure overhead and completely neutralizes background corporate telemetry risks.
  • Asynchronous Local Syncing: The web substrate is engineered to operate entirely offline or within isolated local network sandboxes. The application retains maximum workflow velocity and interface responsiveness regardless of external internet infrastructure stability.

Implementing True Cryptographic Delegation

Bypassing captured legacy systems requires building new, un-enclosable horizontal communication loops outside their compliance gardens.

  • Zero-Knowledge Architecture: We have implemented zero-knowledge end-to-end encryption protocols. Your data arrays and causal maps are cryptographically sealed at rest and in transit, meaning no centralized host or corporate middleman can ever peek inside, manipulate, or extract your insights.
  • Cryptographic Delegation Loops: Traditional, vulnerable supervisory control loops are replaced with secure cryptographic delegation. Users can safely delegate specific data-handling tasks or access privileges across their teams without compromising the core security of their local system.

Connecting the Sovereign Commons Horizontally

Version 4 materializes our philosophy of asymmetric displacement—building local-first infrastructure until captured legacy systems become completely irrelevant in your domain.

  • Peer-to-Peer Verification Networks: Instead of relying on a centralized platform to host and validate shared insights, Version 4 allows independent nodes to connect directly and horizontally. You can now trade value, map regional variables, and verify information peer-to-peer across trusted local networks.
  • Co-Hardening Open-Core Collaboration: By deploying this open-source architecture directly into the field, we transform passive software renters into active co-hardening collaborators. Communities can now independently deploy, host, and protect their own localized information commons.

The Sovereign Reality

Version 4 marks the transition of Datagotchi Labs from an analytical visualization sandbox into a full-fledged Sovereign Enterprise OS. By combining the behavioral rigor of Joint Cognitive Systems with the absolute security of local-first P2P cryptography, we have built a cognitive sanctuary where local communities and enterprises no longer need to check the boxes of a broken centralized system just to survive, cooperate, and build wealth.
Version 3: Complete Cognitive Sensemaking & Substrate Visualization

To resolve the text-fatigue and relational deficits exposed by the Version 2 web sandbox, Version 3 was architected through the formal research lens of Sensemaking. Sensemaking is the critical cognitive process humans deploy to reconstruct a coherent model of reality when disrupted by sudden systemic shocks, work interruptions, or accelerating waves of institutional misinformation.

Streamlining the Ingestion Pipeline

To eliminate the massive process debt of manually hoarding detached news links before categorizing them, the data ingestion architecture was tightened:

  • Contextual Ingestion: Users were empowered to inject new primary source URLs directly inside an active macro-insight workspace. By bypassing the multi-step curation queue, the system instantly bound raw evidence to its logical destination at the moment of discovery.

The Visual Translation Layer: Mapping systemic Pain Points

To solve the “communication barrier” of Version 2—where flat text lists failed to convey why an insight was surprising or urgent—Version 3 introduced a specialized semantic and emotional visualization layer:

  • Deterministic Problem & Solution Tagging: We introduced high-visibility “Red Problem Tags” to visually isolate structural threats and systemic vulnerabilities. These tags were systematically summarized at the apex of each workspace, transforming dense prose into immediate, scannable cognitive markers.
  • Coherence & Validation Mechanics: To allow community networks to collectively vet assertions, we engineered decentralized ranking, voting arrays, and granular emoji reaction matrices directly into the metadata headers. This turned a solitary reading experience into a collaborative cross-examination framework.

Constructing Sensible Narratives through Inter-Insight Networks

The core breakthrough of Version 3 was moving completely away from isolated, flat dashboards and moving toward a dynamic, connected system substrate:

  • Relational Node Visualization: We implemented explicit connection protocols between disparate insight spaces. Users could anchor visual and structural links between internal nodes, or map external URLs to insights hosted on distributed sibling sites.
  • Automated Insight Generation: To capture fluid, un-enumerated human thoughts before they evaporate into cognitive load decay, the system was configured to automatically spin out entirely new, independent insight nodes directly from deep comment threads.
  • High-Context Interface Substrate: Standard, un-expressive blue hyperlinks were completely replaced with rich semantic iconography. The interface was optimized to visually differentiate between internal insights, verified/saved local nodes, and raw, unsaved external links at a single glance.

Version 2: Datagotchi Labs

As I founded my R&D company, Datagotchi Labs, I decided to work on PMBoard again with the belief that new technologies should be created if and only if they provides users with value. However, startups are incentivized by people with money (investors and paying customers) because they need to be able to pay their employees. Therefore, most startups offer free apps/services to end users so they can turn them into the products to be sold to advertisers.

Instead, the needs and desires of all product stakeholders need to be understood and synthesized when creating and improving products. Therefore, my new approach is to visualize stakeholder UX research in the form of empathy maps and product visions as journey maps created from those empathy maps.

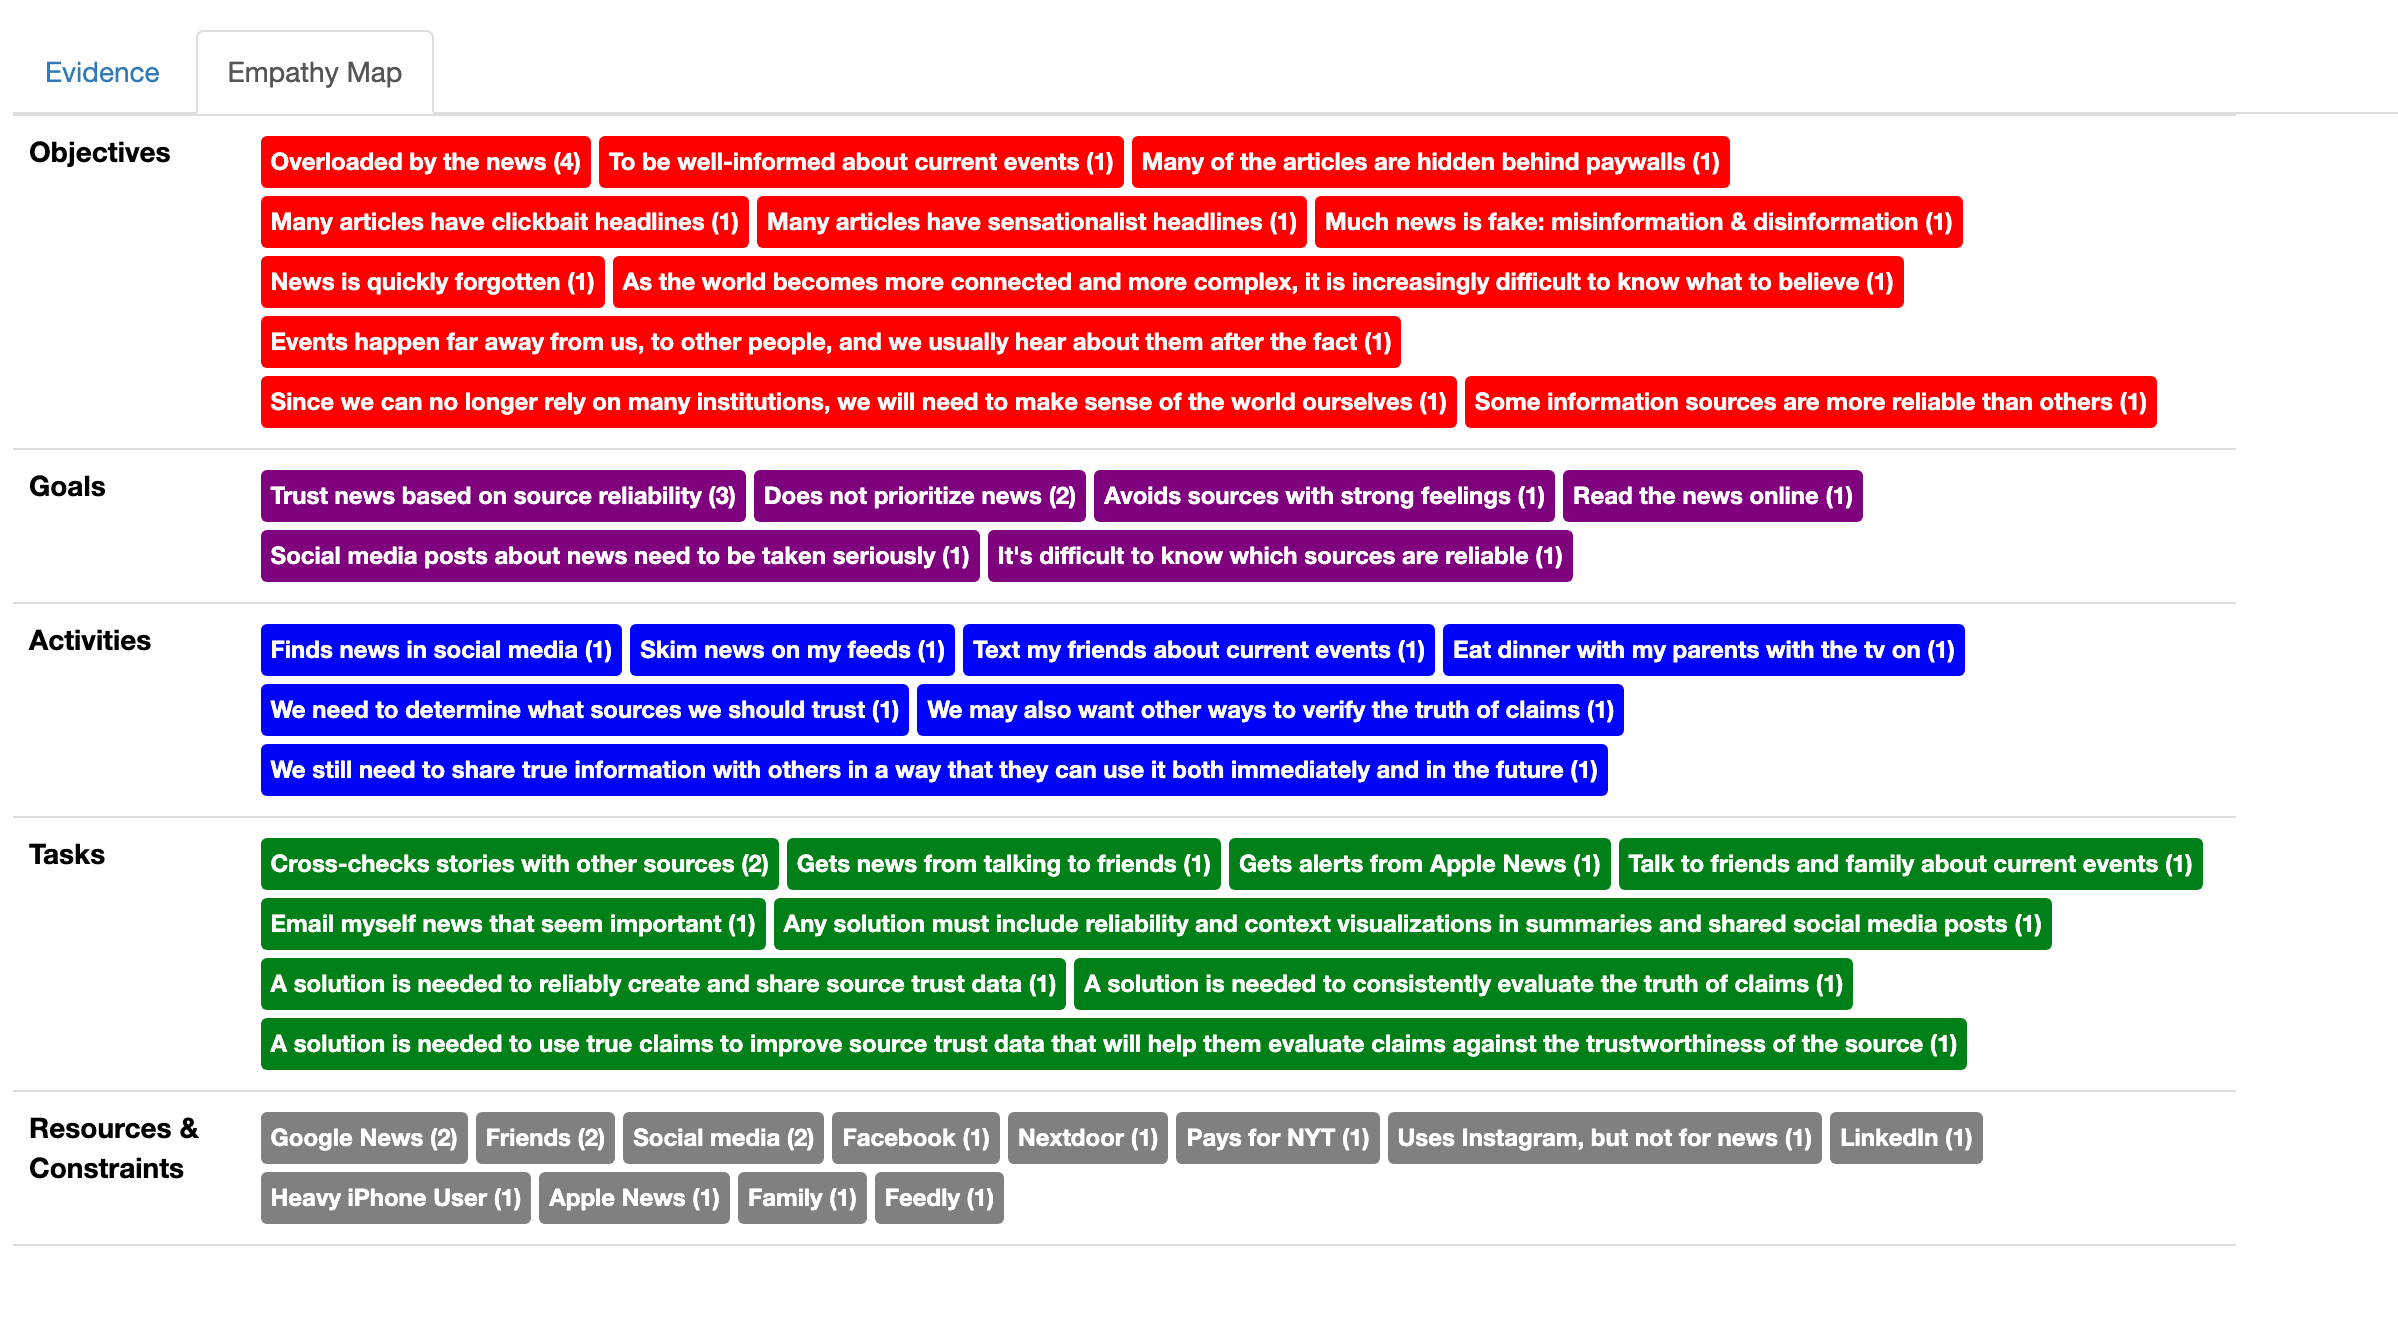
The empathy maps used means-ends hierarchies from cognitive work analysis that I learned in my government R&D days, which map high-level objectives to goals to achieve the objectives, to activities to achieve the goals, tasks to achieve the activities, and resources/constraints to achieve the tasks:

I have started on a widget to create journey maps that cite these empathy maps, but have not finished it yet, therefore it’s still in progress (no image available at this time).

Version 1: Social Ergonomics

There is so much information involved in the creation of new products, as well as through minimum viable product (MVP) iteration and eventually growth. However, startups and R&D teams rarely collaborate enough to effectively harness this information.

Therefore, a friend of mine and I founded Social Ergonomics, a consulting firm for startups and other companies in the San Francisco Bay Area in California, to enable them to act as Integrated Product Teams (IPTs), a concept I learned from my government R&D days.

IPT members need to do:

  • Stakeholder research to deeply understand the problems and the stakeholders affected by them so that they can make smart decisions when the answers aren’t obvious — over time as stakeholders and their contexts change.
  • Market research to be able to explain why their solution is better than all other possible solutions.
  • MVP iteration to commercialize their product / find problem-solution fit and product-market fit
    • To be able to evaluate whether users resonate with their solution enough to evangelize it to others (p-s fit)
    • To be able to evaluate whether people are willing to pay for their solution, and keep using it and paying for it over time as it remains useful (p-m fit)

To support these needs, we created a tool we called PMBoard and made it open source on GitHub.com: https://github.com/bobness/pmboard

  • For stakeholder research, it includes a widget to link Google Documents and tag them with insights.
  • For market research, we envisioned a widget to link research insights with user journeys.
  • For MVP iteration, we envisioned a widget to link research insights and user journeys to designs and software prototypes and user analytics data.

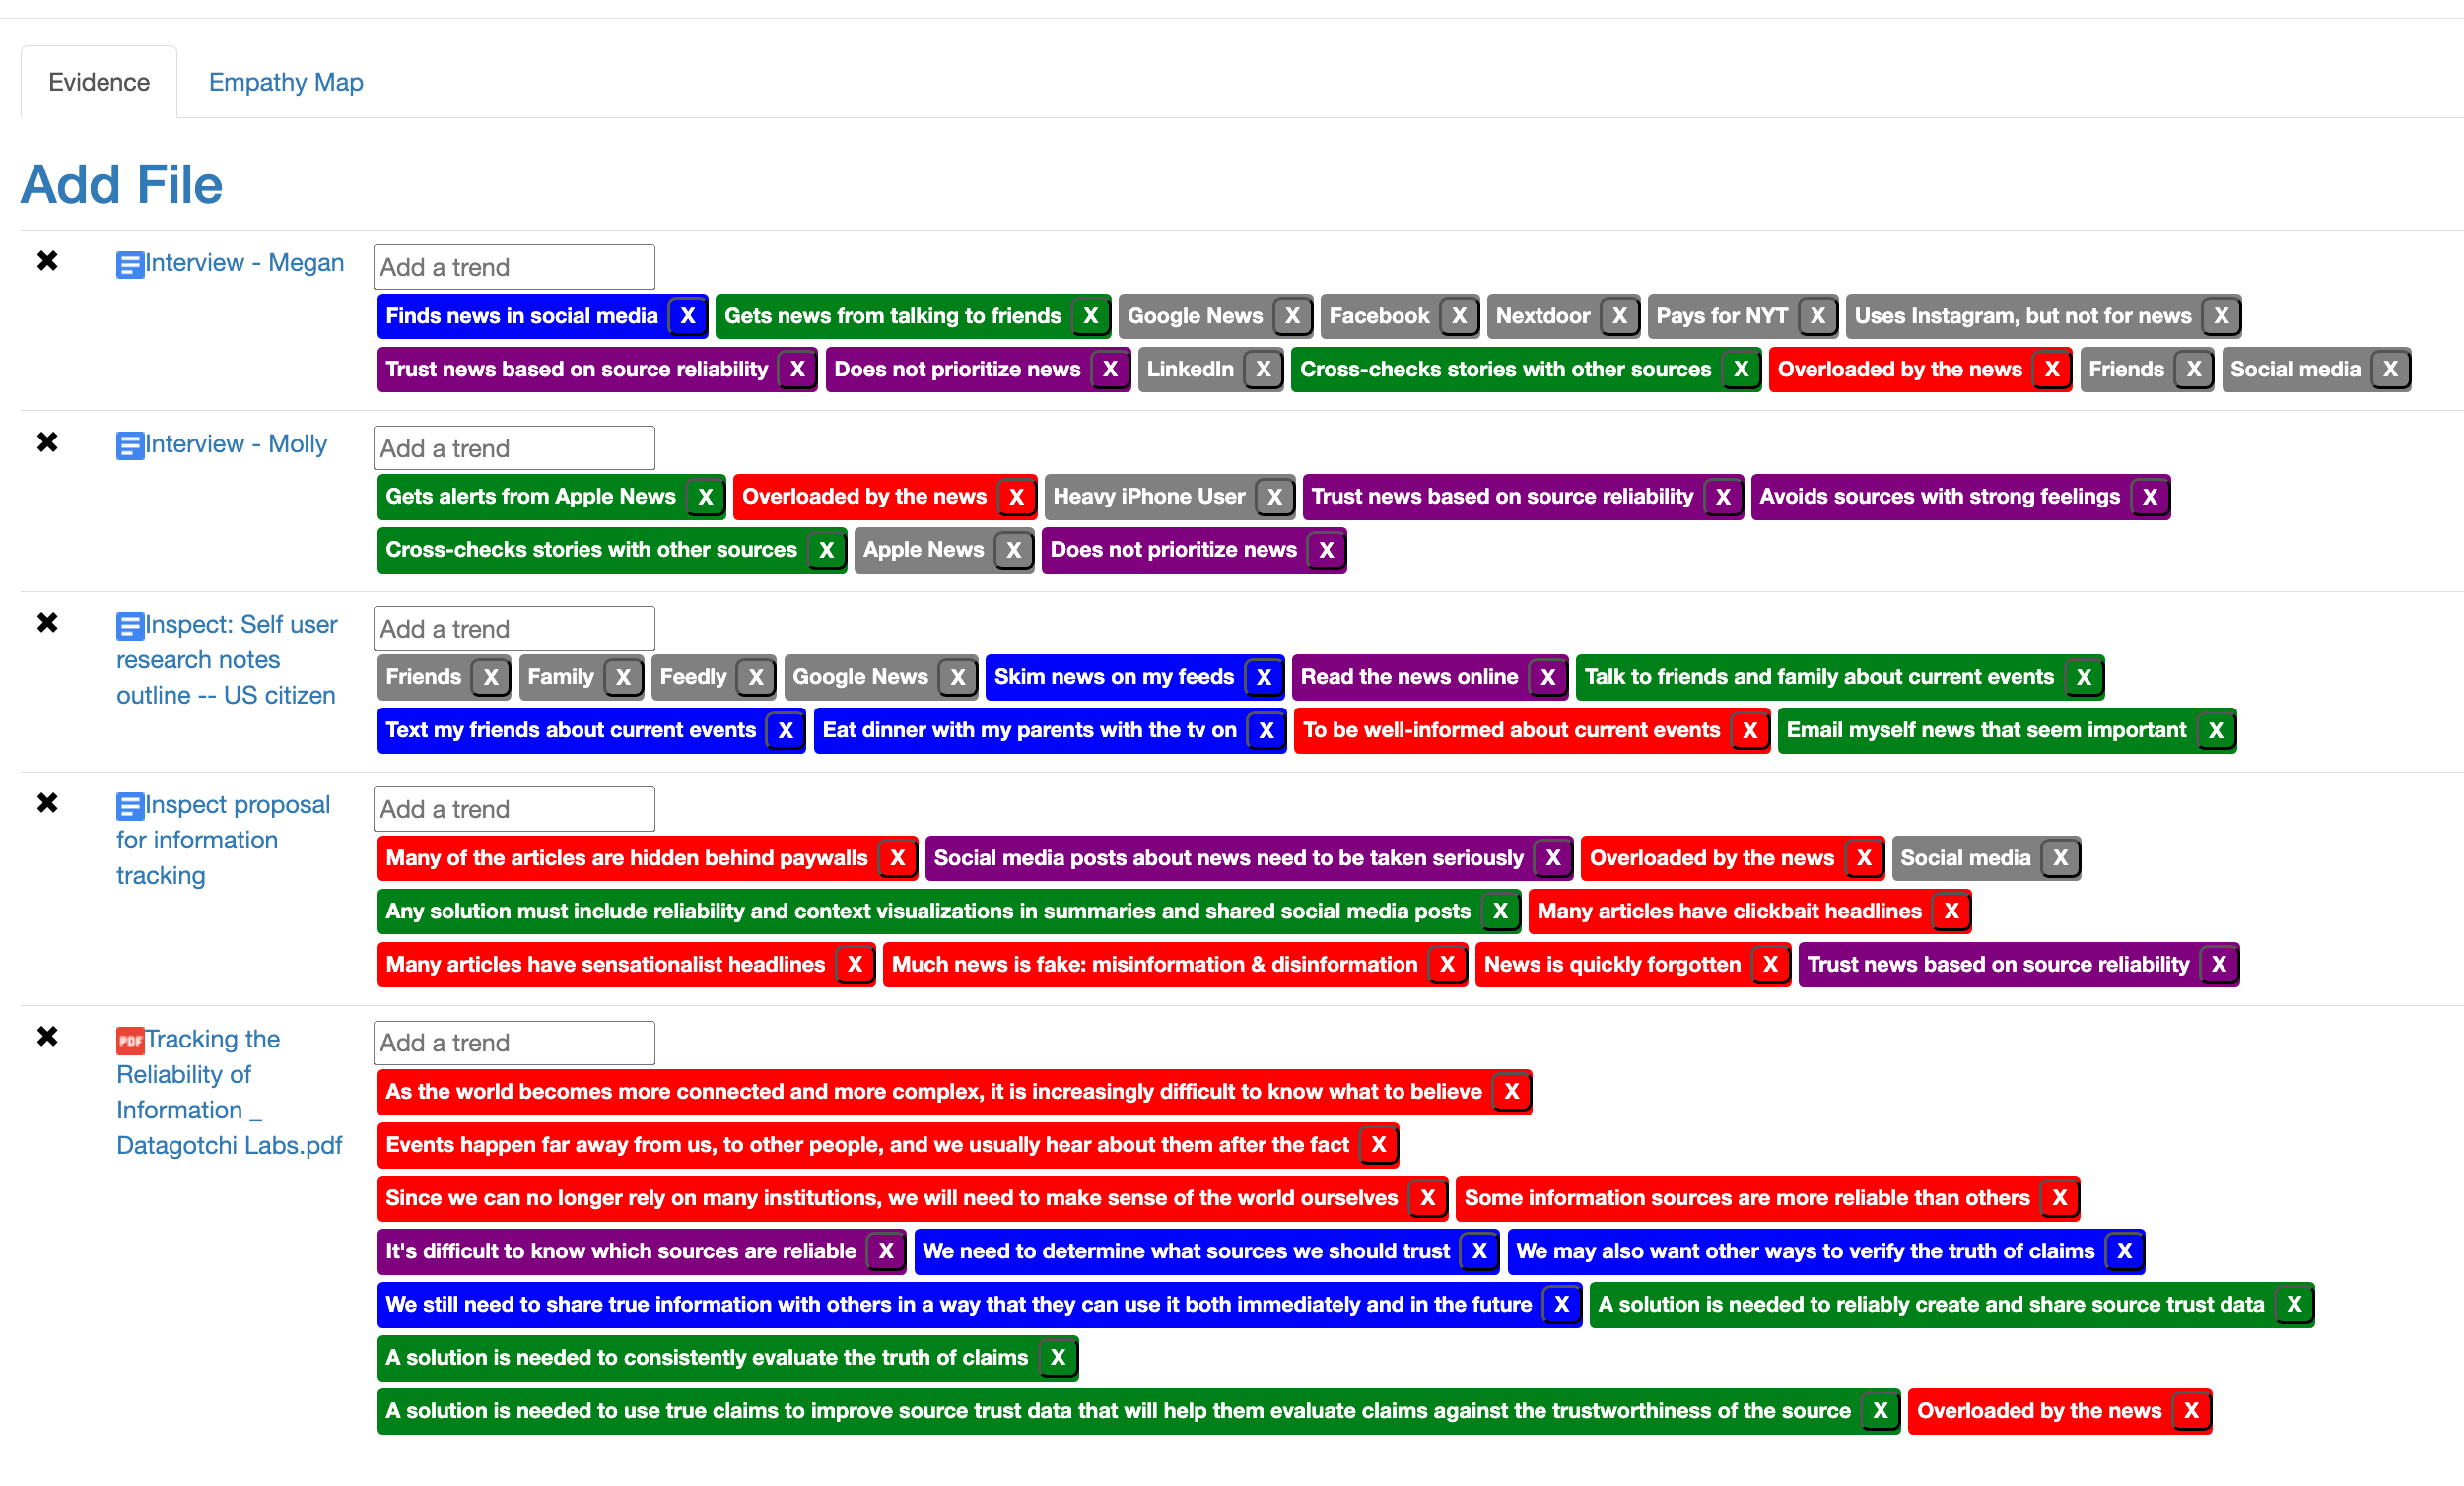
However, we never got around to the last two widgets. So the tool to tag user research looked like this:

Version 2: High-Velocity Web Application Sandbox

Based on the strategic diagnostics gathered from the version 1 mobile prototype, I engineered a second architectural iteration designed to systematically mitigate information overload and eliminate platform friction.

Core Architectural Shift: Cloud-Based Persistence

To bypass the “platform resistance” discovered in Version 1—where users rightfully rejected downloading separate mobile apps for intermittent tasks—I migrated the system infrastructure to an accessible, cross-platform web topology.

  • The Transition to Next.js: I refactored the original Node.js backend into a highly responsive, unified Next.js web application matrix.
  • Cloud Ingestion Sandbox: Users could instantly ingest online content links directly into a secure cloud backend simply by copying browser URLs into the system, bypassing traditional ecosystem silos.
  • Deterministic Insight Declarations: I built explicit workflows to manually declare complex insights as core assertions. Users could generate a blank macro-insight and dynamically map empirical data parameters straight to it.

Interface Engineering: Complex Data Aggregation

To address the sheer velocity of daily media streams, the interface was optimized to let users bind multiple content links into unified, high-context insight repositories:

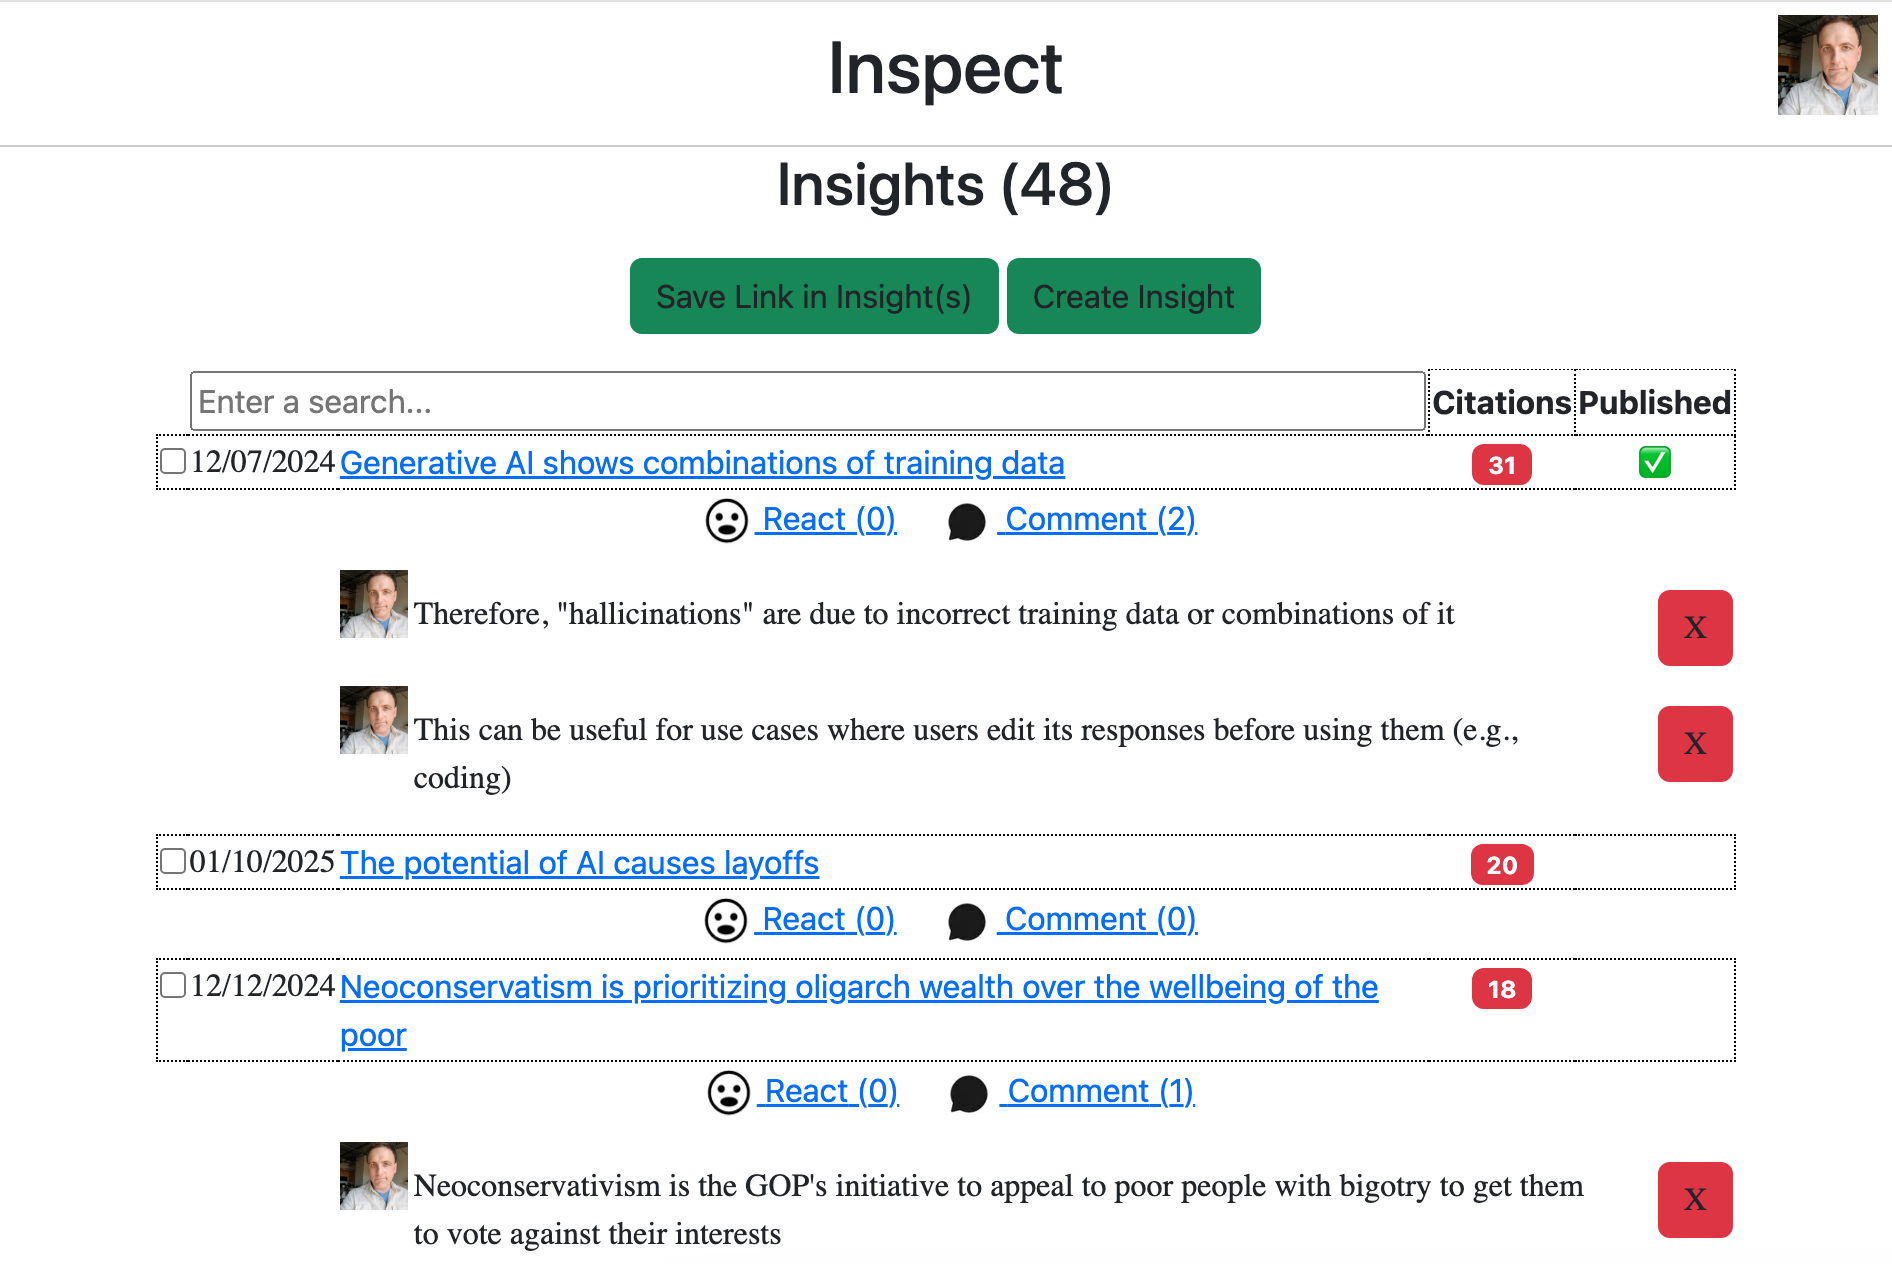
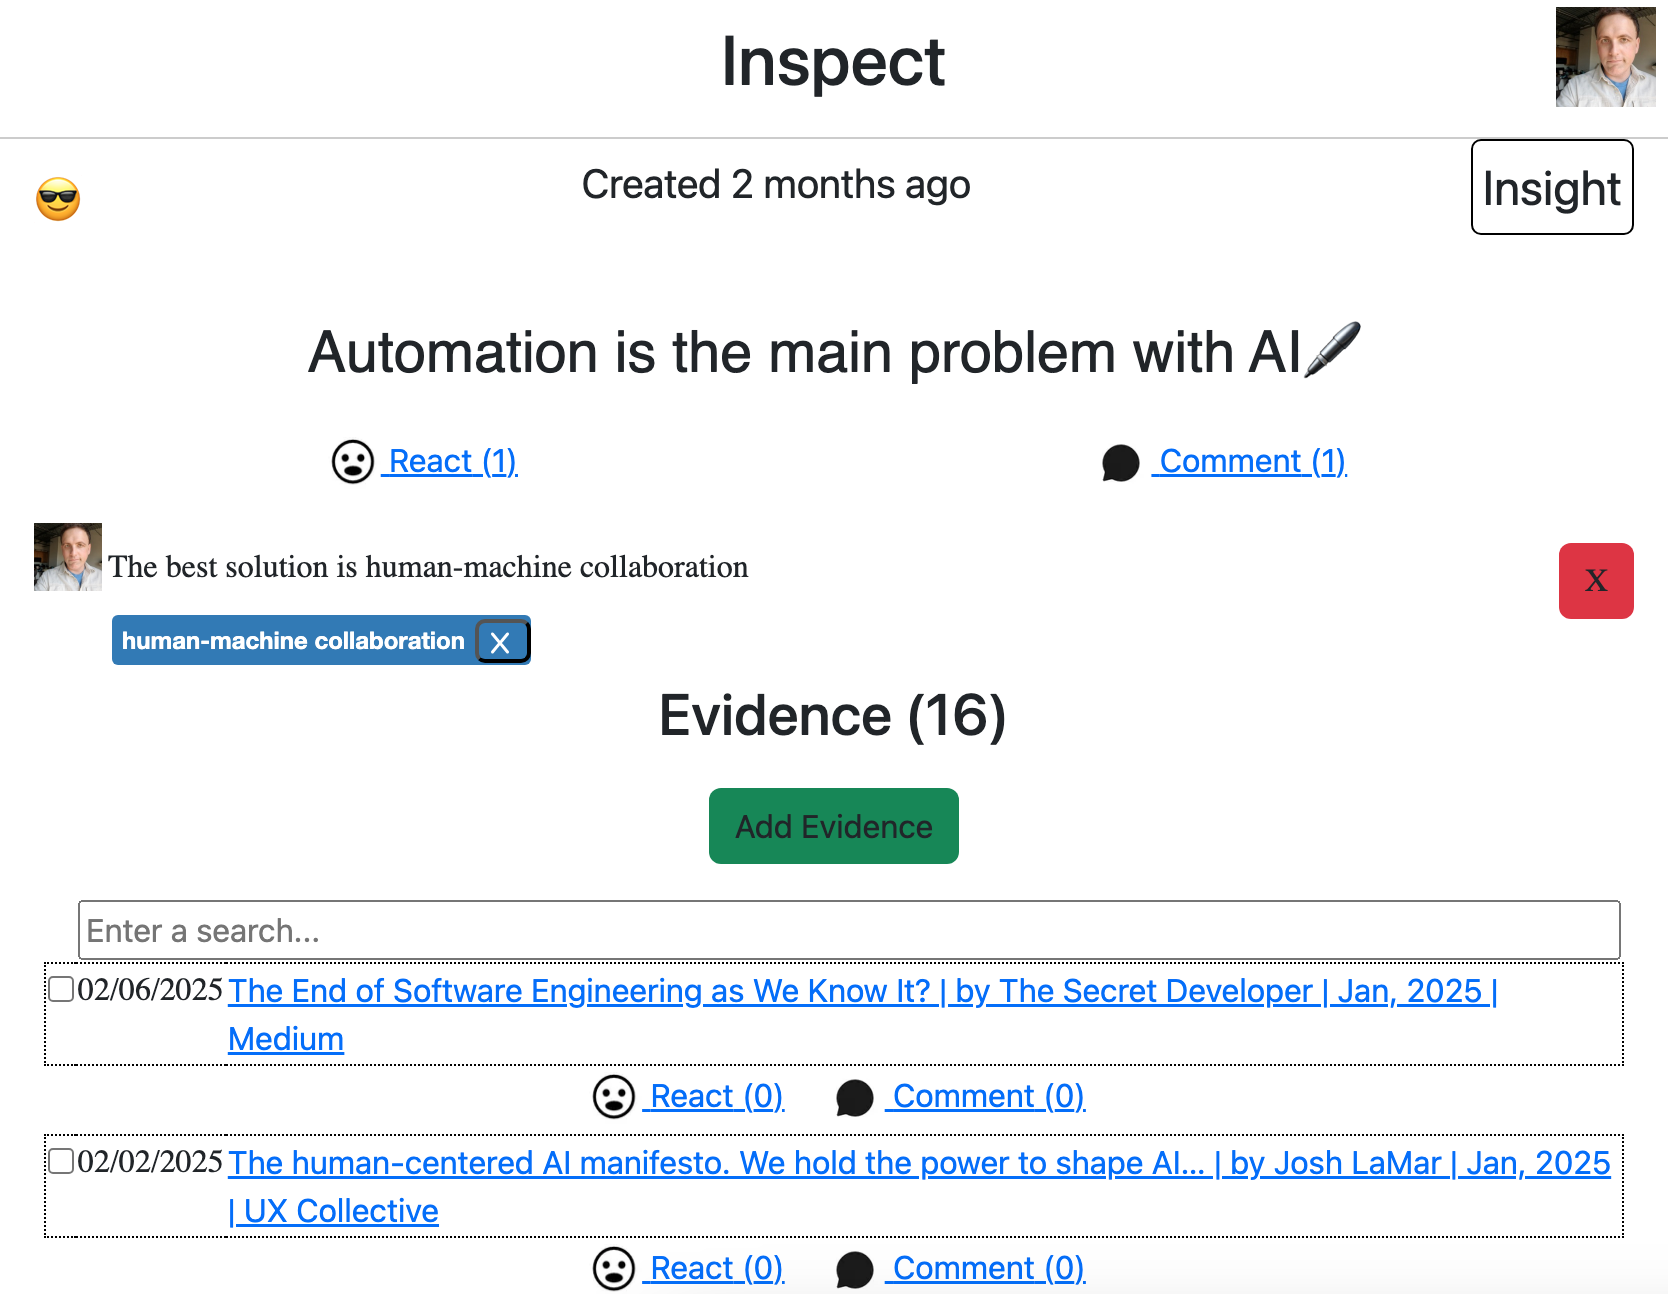
  • Evidence Binding Arrays: Built modular UI structures allowing users to rapidly select multiple ingested URLs from a dynamic dialog menu and bind them directly into a single, cohesive conclusion.
  • Multi-Threaded Cross-Citations: Engineered advanced UX pathways to manipulate structural data on the fly. Users could select specific citations within an insight, extract them, and cross-reference them directly into other expanding system models.
  • Granular Semantic Layering: Implemented interactive commenting and text-highlight tagging systems. This allowed users to isolate the core causal variables of a specific news link, tag the top-level assertions, and bubble those insights up to public-facing networks via a single-click publishing protocol.

The resulting web application is pictured below:

Critical Discoveries from the Web Sandbox

Publishing this web platform and stress-testing it against live news cycles and complex technical streams revealed profound new insights into user cognitive limits:

  • The Ingestion Process Debt: Manually collecting individual news articles as they appear online to curate and compile them later into insights requires massive, unsustainable human labor.
  • The Communication Barrier: While the raw infrastructure functioned perfectly, communicating complex, surprising, and high-consequence system patterns to an outside audience via text lists remained incredibly difficult.
  • The Text-Overload Paradox: While comments and text-highlight tags were highly effective at explaining what an insight meant, they inadvertently generated an overwhelming wall of dense prose. The interface was still causing user cognitive fatigue—it had merely shifted the overload from the original news feed to the application’s own text commentary.
  • The Relational Deficit: A flat vertical list of insights, comments, and tags is a failed interface substrate for system dynamics. It tracks the individual data points but fails to visually show how those points relate, why they interact, or how a macroeconomic shock ripples through a community network.

Version 1: Mobile Application Prototype

Online information overloads us because it is no longer geographically, materially, or socially constrained. Since we can no longer rely on legacy captured institutions, we must make sense of a volatile world ourselves.

Therefore, we need an information architecture that can:

  • Reliably create and share source trust data without centralized gatekeepers,
  • Consistently evaluate the causal truth of claims across fragmented data streams, and
  • Use verified claims to continuously improve network-wide source trust vectors.

To support these critical operational needs, I envisioned:

  • An Ontology-Driven Source Evaluator to index information nodes,
  • A User-Centered Claim Evaluator to unpack complex arguments, and
  • Combined, an Iterative Truth Propagation Process to dynamically scale shared understanding.

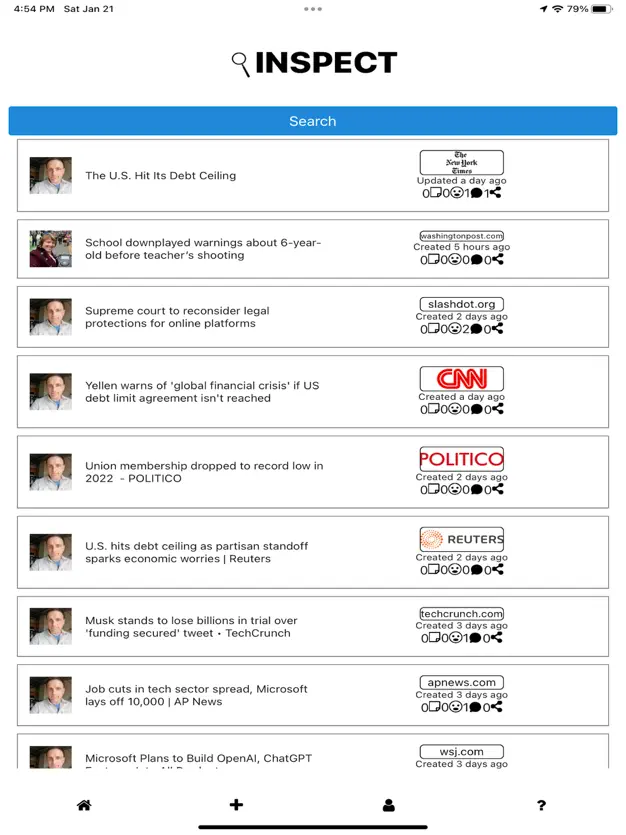
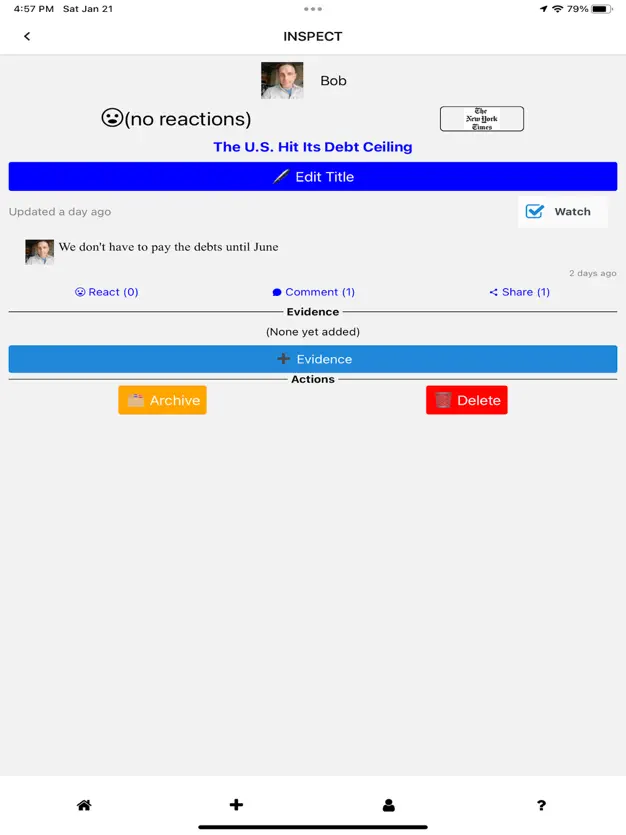
I created this initial mobile prototype with React Native so it deployed natively across iOS (iPhones, iPads, Apple TVs) and Android. Because users have largely converged to only ingesting information that they subscribe to via closed newsletters, algorithmic feeds, or niche platforms (e.g., Google News, Apple News+, etc.), I focused the interface on mapping and following specific authors you already know and trust.

I tested this mobile app sandbox with friends and family members, and found critical diagnostic bottlenecks:

  • The Extraction Trap: Critical information often takes the form of clickbait headlines and is hidden behind predatory corporate paywalls because legacy companies are incentivized by profit extraction, not human cognitive clarity. However, this data remains vital for us to make good decisions and govern our operations.
  • The Cognitive Failure: Users are still heavily overloaded by the sheer volume of news articles published every single day. A linear mobile feed is a failed interface substrate for handling high-velocity, multi-variable data streams.
  • The Platform Barrier: People do not want to download yet another centralized mobile app—especially for a high-consequence sensemaking task they do not perform on a casual, everyday basis.